by Ian Matheson and Nancy Hutchinson
Mathematics is a subject that deals with abstract ideas in order to solve problems. Information can be represented with numbers, words, and other types of symbols. Representing information with symbols can be a difficult practice for students with learning disabilities (LDs) to understand, and eventually begin to use themselves.
Information is often represented visually in mathematics as a method of organizing, extending, or replacing other methods of presentation. Visual representation in mathematics involves creating and forming models that reflect mathematical information (van Garderen & Montague, 2003).
LDs and Problem-Solving
Although there are a number of problem solving strategies that students use in mathematics, good problem solvers usually construct a representation of the problem to help them comprehend it (van Garderen & Montague, 2003). Students with LDs can have an especially challenging experience solving problems in math, and research suggests that their use of visual representation strategies differs from their typically-achieving peers in:
- frequency of use (Montague, 1997),
- type of visual representations used (van Garderen & Montague, 2003), and
- quality of visual representations (van Garderen, Scheuermann, & Jackson, 2012b).
Creating a visual representation to solve a problem in mathematics is a process that involves:
- processing the information in the problem,
- selecting important information, and
- identifying the goal of the problem.
Students with LDs struggle with visual representation in mathematics because they typically have difficulties processing information (Swanson, Lussier, & Orosco, 2013).
Visual representation is an important skill because higher-level math and science courses increasingly draw on visualization and spatial reasoning skills to solve problems (Zhang, Ding, Stegall, & Mo, 2012). Additionally, it is simply another strategy that students can use when they are thinking of the best way to answer a problem in mathematics.
The Importance of Explicit Instruction
Perhaps the most consistent message in the literature about visual representation in mathematics is that it needs to be explicitly taught to students. Representing information visually is not a skill that comes naturally to students, and so it must be taught and practiced.
When first introducing a new skill to students, it is important to model the skill in order for them to see how it is used followed by opportunity for students to try it themselves.
The concrete-representational-abstract (CRA) approach to instructing students is a method of explicit instruction that is supported by research as being effective for students with LDs (Doabler, Fien, Nelson-Walker, & Baker, 2012; Mancl, Miller, & Kennedy, 2012). The concrete level involves the use of objects to represent mathematical information (e.g., counters, cubes); the representational level involves the drawing of pictures to represent the objects that were used in the previous level; and the abstract level replaces pictures of objects with mathematical symbols and numbers.
Scaffolding is another approach to teaching visual representation to students with LDs that is supported by research (van Garderen, Scheuermann, & Jackson, 2012a). Scaffolding involves the use of temporary supports during the learning process as needed by the student. Providing a student with an incomplete diagram and having them finish it and then use it to solve a problem is an example of a scaffolding technique.
Types of Visual Representation
When you are talking about visual representation in mathematics, you may be talking about representing information on a page with a diagram or chart, or representing information in your head with an image. Fortunately, researchers have focussed on helping students improve their visual representation both externally (e.g., van Garderen, 2007) and internally (e.g., Zhang et al., 2012). Developing both external and internal visual representation strategies is important for students as both help support student learning in mathematics for different types of problems.
In addition to the distinction between internal and external visual representations, researchers have also outlined differences in visual imagery based on the purpose. Pictorial imagery is used for representing the visual appearance of objects or information. Schematic imagery is used for representing the spatial relationships between objects or information. While both can be used to help students learn and solve problems in mathematics, schematic imagery is more effective as a method for supporting problem solving. Students with LDs are more likely to use pictorial imagery when solving problems in math (van Garderen & Montague, 2003).
External Visual Representation
 Representing visual information in mathematics externally can be done in a number of ways. While it is possible to represent one set of information using a range of different visuals, students are usually taught that certain types of visual representations are better for certain types of information.
Diagrams and graphic organizers are two types of external visual representations that are used in mathematics, and both are supported by research for use with students with LDs. This is a type of visual representation that can be modelled to students as it is something that can be seen on a page or on the board at the front of the class.
Diagrams
Diagrams are visual displays that use the important information in mathematical problems. They are typically used to demonstrate how the important information is related, and can be used to organize information as well as to compute the answer to a problem. A common type of diagram might be a drawing that a student creates to represent the objects within a word problem.
Individuals with LDs may have a poorer understanding of what a diagram is, as well as when and how to use it (van Garderen et al., 2012b). Diagrams are effective for students with LDs as they can help highlight essential information and leave out information that is not necessary for solving a problem. This can simplify the problem-solving process (Kolloffel et al., 2009).
Distinctions can be made between pictorial diagrams and schematic diagrams. An example of a pictorial diagram would be a drawing of the important objects within a word problem, while a schematic diagram would be a drawing that includes the spatial relationships between the objects. As mentioned earlier, schematic diagrams are more useful for students and typically result in more success with problem solving (van Garderen & Montague, 2003).
Tree Diagrams

A tree diagram is a method of representing independent events or conditions related to an action, and it is often used to teach students probability theory.
This type of diagram might be used to teach students about probability through coin flipping or through drawing from a deck of cards. It is considered a powerful method of teaching probability in math, and is a great example of a visual representation that is a diagram (Kolloffel, Eysink, de Jong, & Wilhelm, 2009).
Number Lines
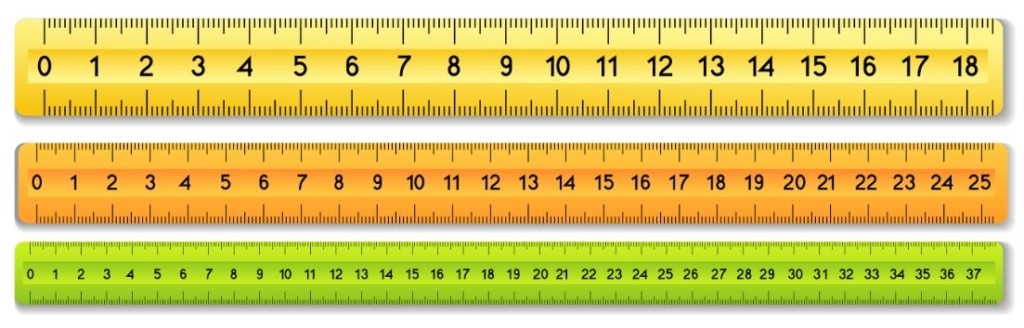
A number line is another type of diagram that is being used increasingly by mathematicians (Gersten et al., 2009). A number line consists of a straight line that has equally spaced numbers along it on points, and can be easily drawn by students for use when solving problems.
Number lines are often used for the teaching of integers, as well as for simple addition and subtraction problems, as they provide students with a visual that they can touch to keep track of their place.
Graphic Organizers
A graphic organizer is another type of external visual representation that is often used in mathematics. There are many types of graphic organizers and each have situations that they are best used for. While graphic organizers are often thought of simply as organizational tools, they can be used to make rapid inferences to solve different types of problems.
Research supports the idea that students with language disorders may benefit from learning and instruction using nonverbal information such as a graphic organizer (Ives, 2007). Additionally, the use of graphic organizers to support learning has been found to improve the comprehension of facts and text for students with LDs at all ages (Dexter & Hughes, 2011), as well as enhancing conceptual understanding in mathematics (Ives, 2007).
Graphic organizers may be a great support for students with LDs because they take some of the organizational pressure off these individuals who may have difficulty sorting through information and seeing the relationships between different mathematical objects or concepts (Ives, 2007).
Four main types of graphic organizers can be used in mathematics:
1. Semantic Maps
A semantic map is one type of graphic organizer that can be used to support learning in mathematics. This type of graphic organizer is mainly used to relate conceptual information, and could be used to support conceptual learning in mathematics.
One example might be to use a semantic map to help young students who are learning to classify shapes into different categories. While shapes might be the main heading, students might organize shapes into further sub-heading such as round, symmetrical, right-angle, etc.
2. Semantic Feature Analysis
A semantic feature analysis is another type of graphic organizer. This graphic organizer is characterized by a matrix format, where features or characteristics of objects or concepts are displayed. A semantic feature analysis might be used to compare shapes in geometry, where comparisons could be made between number of sides, vertices, types of angles, etc.
3. Syntactic/Semantic Feature Analysis
A syntactic/semantic feature analysis is similar to the semantic feature analysis, but sentences are added in to help students identify specific features about each object.
An example sentence that might follow the matrix is “A ________ has the most sides of all of the shapes we have looked at.”
4. Visual Displays
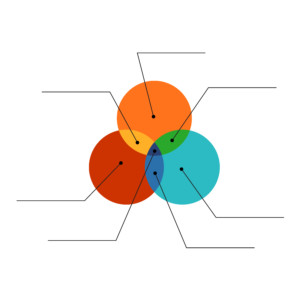 Finally, a visual display is a type of graphic organizer that can be used in mathematics for displaying spatial relationships very clearly. Visual displays can be used for a number of different purposes. One might make comparisons between objects or concepts using a Venn diagram, or display information temporally using a timeline to compute the answer to a word problem.
Selecting the Appropriate Graphic Organizer
Though each type of graphic organizer can be used for learning mathematics by individuals with LDs, the differences in their design suggest that they may be best used in specific situations.
- Semantic maps and Semantic feature analyses are considered to be better for recalling facts though they are more difficult to understand and to learn how to use (Dexter & Hughes, 2011).
- Syntactic/semantic feature analyses and visual displays are considered to be more efficient for making computations to solve problems, and for recalling the information within these types of graphic organizers (Dexter & Hughes, 2011).
The advantages to each type of graphic organizer suggest that initial instruction of a mathematical concept may be best with more complicated graphic organizers, and that independent review and studying could be done with less complicated graphic organizers to improve recall of information for students with LDs (Dexter & Hughes, 2011).
Explicit Instruction of External Visual Representation
It is important to remember that explicit instruction is necessary for both diagrams and graphic organizers. This instruction should highlight the purpose of each type of external visual representation, as well as when and how to use them. Both types of external visual representations can be easily modelled for students as educators can physically construct them and explain their thinking as they do so in front of students.
In a study conducted by van Garderen (2007), the researcher examined the effectiveness of a three-phase instructional strategy for teaching students with LDs to use diagrams in mathematics:
- The first phase involved explicit instruction about what diagrams are, as well as how and when they are used.
- The second phase connected the use of diagrams to one-step word problems, where students created diagrams that represented the information that they knew and the information that they did not know.
- The third phase was focused on two-step word problems which have more than one unknown piece of information, and students used diagrams to determine the ultimate goal of the problem, as well as the secondary pieces of information that they would need to find in order to compute the ultimate goal.
Teaching students with LDs to use diagrams with this sequence of explicit instruction resulted in improved performance, satisfaction of the students, and students were also more likely to use diagrams with other types of problems.
Internal Visual Representation
While external visual representation can be easy to model and teach explicitly to students, internal visual representation is not as easy to show students as it is a mental exercise. A visual schematic representation involves the creation or recall of visual imagery to represent information.
Students are often asked to visualize the problem in order to better understand it and solve it. This can be a difficult task for students and it should not be assumed that this is a skill that all students already possess.
To create a mental picture when solving a word problem in math, students must combine information from the problem with their prior knowledge of the topic. While students cannot see the mental images that their teachers create, it is still possible to walk students through the process of creating the mental image as a verbal model, or even to draw images of what they are seeing in their head to make it more explicit.
Click here to access the article Verbalization in Math Problem-Solving.
A group of researchers (Krawec, Huang, Montague, Kressler, Melia de Alba, 2012) developed an intervention to support students with LDs as they solve problems in mathematics. The intervention was aimed at explicitly instructing students about the cognitive processes that proficient problem solvers use in math, including visualization. The intervention was delivered by teachers who were trained to follow a sequence of instruction that included teaching visualizing to the students. The intervention involved the teachers “thinking aloud” as they progressed through the stages of the problem solving process. Students who were a part of the intervention reported using more strategies when solving problems in math, including the strategy of visualizing the problem (Krawec et al., 2012).
Visual-Chunking
One strategy that teachers can use to support their students with LDs in creating internal visual representations is known as visual-chunking representation. Chunking is the practice of combining bits of information that are related in some way in order to reduce the overall amount of information for easier processing. For students with LDs, a reduction in the amount of information to be processed can make exercises such as math problem solving much easier.
A group of researchers examined one method of visual-chunking for students with difficulties in math, where students were working with geometric shapes and transformations (Zhang et al., 2012). One group received series of nets of geometric shapes, while another group received the same nets, though sections had been shaded or “chunked” in an effort to see if it made a difference in their transformations. The group that received the visual-chunking support performed better than the other group, and found the exercise to be easier when provided with the visual-chunking support (Zhang et al., 2012).
Visual Schematic Representations
Visual schematic representations have been shown to be effective for individuals with specific difficulties in math, which can include LDs (Swanson et al., 2013). Instructing students about how to create internal visual representations can be difficult as it does not easily lend itself to explicit instructional techniques. Despite this challenge, teachers can still support the development of this skill by creating diagrams of their mental images as well as by thinking aloud as they are visualizing while problem solving.
Conclusion
The use of visual representation during instruction and learning tends to be an effective practice across a number of subjects, including mathematics (Gersten et al., 2009). While using visual representation alone as a teaching method does produce significant learning improvements for students in mathematics, these improvements are even greater when other teaching methods are used as well (Gersten et al., 2009).
Having students represent mathematical information verbally and in written form along with visual representation is encouraged. For students with LD, both receiving instruction and solving problems in a number of ways will help support their deeper understanding of concepts and operations in mathematics (Suh & Moyer, 2007).
The importance of using explicit instruction to teach students how to make visual representations cannot be overstated. The CRA method is an example of an effective sequence of explicitly instructing students with LD to use visual representation as a step towards the use of mathematical symbols exclusively (Mancl et al., 2012).
There are many types of diagrams (Kolloffel et al., 2009) and graphic organizers (Dexter & Hughes, 2011) that can be effectively used support students with LD in mathematics. While internal visual representation can be difficult to model, strategies do exist that can support students with LD as they develop this skill (Zhang et al., 2012). Educators are encouraged to use a combination of external and internal visual representation strategies in their instruction to students in the interest of helping students develop both types of skills.
Related Resources on the LD@school Website
Click here to access the article Verbalization in Math Problem-Solving.
Click here to access the article Mind Maps.
References
Dexter, D. D., & Hughes, C. A. (2011). Graphic organizers and students with learning disabilities: A meta-analysis. Learning Disability Quarterly, 34, 51-72.
Doabler, C. T., Fien, H., Nelson-Walker, N. J., & Baker, S. K. (2012). Evaluating three elementary mathematics programs for presence of eight research-based instructional design principles. Learning Disability Quarterly, 35, 200-211.
Gersten, R., Chard, D. J., Jayanthi, M., Baker, S. K., Morphy, P., & Flojo, J. (2009). Mathematics instruction for students with learning disabilities: A meta-analysis of instructional components. Review of Educational Research, 79, 1202-1242.
Ives, B. (2007). Graphics organizers applied to secondary algebra instruction for students with learning disorders. Learning Disabilities Research & Practice, 22, 110-118.
Kolloffel, B., Eysink, T. H., de Jong, T., & Wilhelm, P. (2009). The effects of representational format on learning combinatorics from an interactive computer simulation. Instructional Science, 37, 503-517.
Krawec, J., Huang, J., Montague, M., Kressler, B., Melia de Alba, A. (2012). The effects of cognitive strategy instruction on knowledge of math problem-solving processes of middle school students with learning disabilities. Learning Disabilities Quarterly, 36, 80-92.
Mancl, D. B., Miller, S. P., & Kennedy, M. (2012). Using the concrete-representational-abstract sequence with integrated strategy instruction to teach subtraction with regrouping to students with learning disabilities. Learning Disabilities Research & Practice, 27, 152-166.
Montague, M. (1997). Cognitive strategy instruction in mathematics for students with learning disabilities. Journal of Learning Disabilities, 30, 164–177.
Suh, J., & Moyer, P. S. (2007). Developing students’ representational fluency using virtual and physical algebra balances. Journal of Computers in Mathematics and Science Teaching, 26, 155-173.
Swanson, H. L., Lussier, C., & Orosco, M. (2013). Effects of cognitive strategy interventions and cognitive moderators on word problem solving in children at risk for problem solving difficulties. Learning Disabilities Research & Practice, 28, 170-183.
van Garderen, D. (2007). Teaching students with LD to use diagrams to solve mathematical word problems. Journal of Learning Disabilities, 40, 540-553.
van Garderen, D., & Montague, M. (2003). Visual-spatial representation, mathematical problem solving, and students of varying abilities. Learning Disabilities Research & Practice, 18, 246-254.
van Garderen, D., Scheuermann, A., & Jackson, C. (2012a). Developing representational ability in mathematics for students with learning disabilities: A content analysis of grades 6 and 7 textbooks. Learning Disability Quarterly, 35, 24-38.
van Garderen, D., Scheuermann, A., & Jackson, C. (2012b). Examining how students with diverse abilities use diagrams to solve mathematics word problems. Learning Disabilities Quarterly, 36, 145-160.
Zhang, D., Ding, Y., Stegall, J., & Mo, L. (2012). The effect of visual-chunking-representation accommodation on geometry testing for students with math disabilities. Learning Disabilities Research & Practice, 27, 167-177.
Method
Searches were conducted of the literature for content appropriate for this topic that was published in scientific journals and other academic sources. The search included online database searches (ERIC, PsycINFO, Queen’s Summons, and Google Scholar). The gathered materials were checked for relevance by analysing data in this hierarchical order: (a) titles; (b) abstracts; (c) method; and (d) entire text.
Relevant journals’ archives were also hand-searched between issues from 2010 and the most recent issues. These journals included Learning Disability Quarterly, Journal of Learning Disabilities, and Learning Disabilities Research & Practice.
![]() Ian Matheson is entering his second year in the PhD program in Education at Queen’s University with a focus in Learning and Cognition. Ian has spent the last two years working as an occasional teacher with the Limestone District School Board where he is certified with the OCT as an elementary school teacher. He is currently involved with the Continuing Teacher Education Centre at Queen’s University where he is an instructor for an Additional Qualifications course.
Ian Matheson is entering his second year in the PhD program in Education at Queen’s University with a focus in Learning and Cognition. Ian has spent the last two years working as an occasional teacher with the Limestone District School Board where he is certified with the OCT as an elementary school teacher. He is currently involved with the Continuing Teacher Education Centre at Queen’s University where he is an instructor for an Additional Qualifications course.
Nancy L. Hutchinson is a professor of Cognitive Studies in the Faculty of Education at Queen’s University. Her research has focused on teaching students with learning disabilities (e.g., math and career development) and on enhancing workplace learning and co-operative education for students with disabilities and those at risk of dropping out of school. In the past five years, in addition to her research on transition out of school, Nancy has worked with a collaborative research group involving researchers from Ontario, Quebec, and Nova Scotia on transition into school of children with severe disabilities. She teaches courses on inclusive education in the preservice teacher education program as well as doctoral seminars on social cognition and master’s courses on topics including learning disabilities, inclusion, and qualitative research. She has published six editions of a textbook on teaching students with disabilities in the regular classroom and two editions of a companion casebook.
Powered by LDAO
LD@school is a signature initiative of the Learning Disabilities Association of Ontario (LDAO), a registered charity and provincial leader in evidence-informed, inclusive, and accessible education.
For over 60 years, LDAO has supported children, youth, and adults with learning disabilities (LDs) and related conditions such as ADHD.
Explore LDAO’s signature platforms:
TA@l’école – French-language resources and professional learning for educators that integrate evidence-informed instruction with equity, identity, and belonging.
LD@home – Family-focused tools and guidance that strengthen partnerships between home and school.
LD@work – Resources supporting transition, self-advocacy, career development, and workplace inclusion.
LD@learning – Online courses and professional learning for individuals supporting learners with LDs and ADHD.